 |
Flying High With Electric Power!
The Ampeer ON-LINE!
Fly the Future - Fly Electric! |
|---|
Site Table of Contents
| President: | Vice-President: | Secretary-Treasurer: |
| Ken Myers | Richard Utkan | Rick Sawicki |
| 1911 Bradshaw Ct. | 240 Cabinet | 5089 Ledgewood Ct. W. |
| Commerce Twp., MI 48390 | Milford, MI 48381 | Commerce Twp., MI 48382 |
| (248) 669-8124 | (248) 685-1705 | (2480 685-7056 |
 | ||
| Board of Directors: | Board of Directors: | Ampeer Editor |
| David Stacer | Arthur Deane | Ken Myers |
| 16575 Brooklane Blvd. | 21690 Bedford Dr. | 1911 Bradshaw Ct. |
| Northville, MI 48168 | Northville, MI 48167 | Commerce Twp., MI 48390 |
| (248) 924-2324 | (248) 348-2058 | (248) 669-8124 |
| The Next Flying Meeting: Date: Saturday, Oct. 1 Time: 10 a.m.
Place: Midwest RC Society 7 Mi. Rd. Flying Flied | ||
| My LiPo Won't Charge to 4.20V On My Charger Ken discusses, tests and verifies LiPo charge voltages, the initial rapid voltage drop after charge termination and LiPo cell/battery self discharge. | |
By Ken Myers In an RC Groups' thread entitled, "How charging upto 4.20 volt per cell? Help Please. !!", the original poster (OP) noted, "Guys,
I use these 2 chargers. https://www.xtardirect.com/products/...iant=529941637 https://www.google.ca/search?hl=en&s...L-8cohm6CpM%3A" There was quite a bit of speculation about why this appeared to be happening, including the suggestion to get a charger where you can set the termination voltage, and it really doesn't matter if it is 4.17V or 4.2V. User Volt_Ampere even stated, "Most chargers are set a little conservative because unless your pack is perfectly balanced, you are overcharging some cells if you go to 4.20V per cell. Balancers are far from perfect in most cheap chargers." That thread inspired the following research. While it seems obvious that a charger that is NOT set to 4.20V per cell shouldn't charge a pack to 4.20V per cell, one set to 4.20V per cell should charge each cell to 4.20V. I decided to investigate further. I believed, at first, the battery itself, and its cells' associated internal resistances and general 'health', played a very significant role in the observed charged voltage. While charging my eight, now seven, 3S 1000mAh LiPo battery packs, I noticed that the poorest performing packs, with the highest internal resistance (Ir) per cell, seldom appeared to be charged to 4.20V per cell, as shown on my Revolectrix Gt500 charger screen, yet, with the identical voltage termination set on the charger, the 'good' packs, with the lowest Ir per cell, appeared to charge to 4.20 volts per cell. I started testing and learning about LiPo batteries at the end of December 2015 and the beginning of January 2016. I purchased eight different 3S 1000mAh packs with various C-rates noted on the label. All of the packs were run through the same 'testing' routine and then put into use during the 2016 flying season. For all practical purposes, they were tested, used and charged equally, except possibly the R60 pack. The packs used for this investigation are named the G25 pack (33 cycles), the R60 pack (24 cycles), the R30 pack (27 cycles), and the T30 pack (32 cycles). Curious about the pack naming? The alphabet letter denotes the brand, for MY records, and the two digit number is the stated C-rating on the label. The two packs with the letter R designation are different brands. Why not state what the brand is? I have only one sample of each pack. It would not be fair to mention the actual brand name based on only one sample. What turned out to be the worst pack used in the original testing, the E30 pack, was not used in any of my recent testing because it no longer exists. Cell #1, the most negative cell, became very high in resistance, and the cell Ir was 'over-range' on the Wayne Giles ESR Meter after charging and data recording at 220C. That is my 'standard' for cell comparisons. The pack was, for all practical purposes, dead after 38 cycles, as it would not 'charge correctly' nor stay in balance. The capacity wasn't there anymore and the power was down. Yes, pack E30 had more cycles than the others, but I could see that it was 'dying'. I used it more frequently. I wanted to see when it would be dead, and that did not take long. None of the packs were ever charged at over a 1C rate, which is 1 amp for these 1000mAh cells. The packs were flown in the FMS SuperEZ Trainer and FliteTest enlarged Old Fogey2. The SuperEZ averaged 5 amps (5C) for 6 minutes and the Old Fogey2 averaged 6.5 amps (6.5C) for 5.5 minutes. The highest maximum current recorded for the SuperEZ power system was 17.8 amps using the R60 pack and for the Old Fogey2 it was 18.2 amps using the R60 pack. The lowest maximum current recorded for the SuperEZ was 14.8 amps using the R30 pack and for the Old Fogey2 it was 12.7 amps using the G25 pack. While 14.8 amps is about the maximum current for the R30 pack and power system, the G25 is a 'good', lower Ir, pack. By the time the G25 pack was flown in the Old Fogey2, there was quite a headwind, so it wasn't necessary to go to full throttle on take off. Test 1
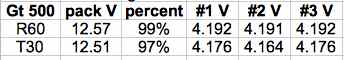
A Wayne Giles ESR (effective series resistance) Meter was used to gather the state of charge (SOC) data for the two packs.
The ESR meter puts a slight load on the pack/cells to turn on its LCD and back light and send a 16 amp pulse to measure the individual cells' Ir. Note that the mOhm readings are at 190C, not the recommended 220C - 250C for comparison to other peoples' readings, but they are comparative to each other. The numbers indicate that the T30 pack has both its pack ESR and individual cell resistances (Ir) almost three times higher than the R60 pack at this temperature. The state of charge (SOC), based on both the pack voltage and cell voltages, are extremely close to equal for the two packs. The Revolectrix Gt500 charger was set to a charge rate of 1 amp (1C for these packs) and the voltage to 4.210V per cell. The 4.210V per cell was caused by my not paying attention while setting the termination voltage on the charger. The R60 pack was charged first and the settings were NOT changed for the T30 pack charge. The Marine/RV battery was fully charged between the LiPo battery charges. The same main lead charge chord was used and the balance leads were plugged directly into the charger. Everything was at the ambient temperature of my basement, at the time, of 190C. Every attempt was made to keep the variables to a minimum. 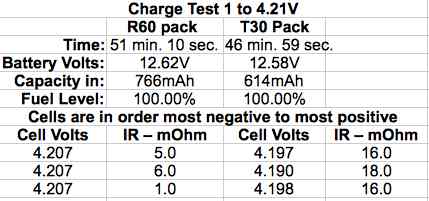 The termination voltages were not recorded at the charger's beep, indicating a full charge, but by the time I looked at the charger. This is significant! After using the charger for a long period of time, I realized that the charger actually took both packs to 4.211V per cell, in this case, and 100% charge. Two conditions prevented the charger's display from showing the termination voltage and percent of charge with the same figures as for the actual termination voltage and percent of charge. A 'good' pack will show 100% charged by the time the charger screen is observed. When a pack is not in 'good' condition, the charger tries to balance the pack, even after the termination voltage is reached. With one of these 'poorer' packs, the charger continues to work hard to balance some of the still unbalanced cells. The percent of charge, after the termination beep, may not be displayed as 100%. I believe the less than 100% charge reporting is caused when the final balance is reached, with some voltage loss, and then charger 'beeps'. There is an initial rapid voltage drop by the cells of the pack. It has nothing to do with the charger taking any current from the battery. The initial rapid voltage drop is just a characteristic of most secondary batteries after charging. The voltage displayed on the charger is for that moment in time. How quickly the voltage is noted, by an observer, will determine the voltage recorded. The effects of the initial rapid voltage drop and the percent of charge, reported of poorer performing packs, are noted through this whole article. There are several things to note here:
Data was gathered from the packs using the Wayne Giles ESR Meter.
The Giles ESR Meter displays only two decimal places for voltage instead of the three displayed by the Gt500. When reading the data presented here, do not make the mistake of assuming that more decimal places represents greater accuracy. The data is simply presented as displayed by its respective meter. Test 2 Because of my termination voltage set error, I repeated the test using the G25 pack and R30 pack. The G25 pack and the R30 pack were at approximately the same state of charge (SOC), based on the resting voltage. Before charging, the data was gathered using the Wayne Giles ESR meter for the G25 pack and R30 pack.
The data showed that the R30 pack had about double the ESR and individual cell internal resistances of the G25 pack. This time the Gt500 was set to a charge rate of 1 amp (1C for these packs) and voltage of 4.20V per cell. Again, everything was at the ambient temperature of my basement, at the time, of 190C. Every attempt was made to keep the variables to a minimum. 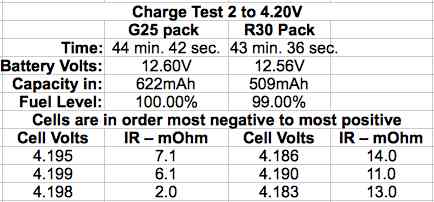 There are several thing to note here:
The Giles ESR meter data immediately after charge completion.
All cells have a self discharge while just setting after being charged. I investigated the self discharge. Using the four charged packs, the resting voltage readings were taken the following day using the Gt500 charger in monitor mode. The temperature was 18.50C, down from 190C the previous afternoon. The termination data is in the row above the following day's data for each pack. 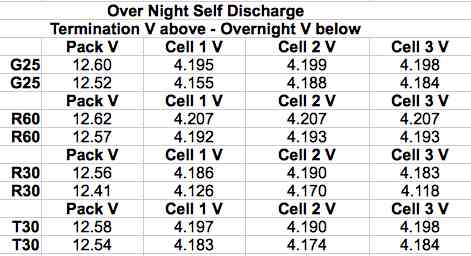 The overnight voltage readings indicate that packs G25, R30 and T30 are having some 'issues' with certain cells. All four packs were flown later that morning in my FMS SuperEZ trainer by a student pilot. All four flights were transmitter throttle stick timed for 6 minutes. When I returned home from the flying field, the Giles ESR Meter and Gt500, in monitor mode, were used on each pack to determine the state of charge voltage (SOC) based on the resting voltage. I made an error after my student landed using the G25 pack and thought I had enough capacity left in the pack to demonstrate one more 'proper' landing. I didn't and over discharged the G25 pack. Giles ESR meter
Gt500
The G25 pack was storage charged to 3.79V per cell. The other three packs were stored at their respective SOC. Using resting voltage to check a pack's remaining capacity varies with the voltage capacity 'table' used by the measuring instrument's manufacturer. The following are the percent of remaining capacity, using the voltages noted above, as reported by the Wayne Giles ESR Meter and the Gt500 charger.
Next I tested to see how long the initial rapid voltage drop lasted and how deep it was, after the charger termination, until the cells were in a more stable state. The G25 pack was fully charged at 1 amp to 4.20V. The pack had been perviously storage charged to 3.79V per cell. At the start of the charge the Gt500 noted the individual cell voltages were just above 3.78V per cell and reported that it was 27% full. 27% of 1000mAh is 270mAh remaining in the pack, therefore I anticipated returning about 730mAh. The charger reported returning 731mAh. Again the charger reported a suspicious, and possibly spurious, mOhm reading for cell #3 of this pack. The cells' Ir, displayed on the charger, at end of charge were; cell #1 7.0mOhm, cell #2 7.1mOhm, cell #3 2.0mOhm. The Ir numbers were inline with the previously recorded G25 pack charge. The following graph shows the voltage drop over a two hour time period. 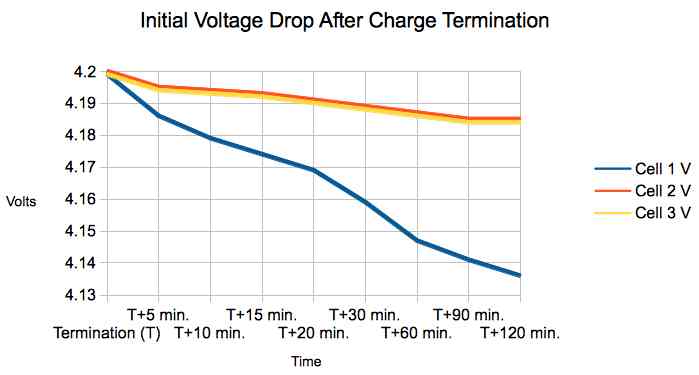 It looked like cell number one was not doing very well, as it had 'lost' a lot more voltage, comparatively, than the other cells, but it is important to keep in mind that it is millivolts (mV) that are being displayed in the graph. 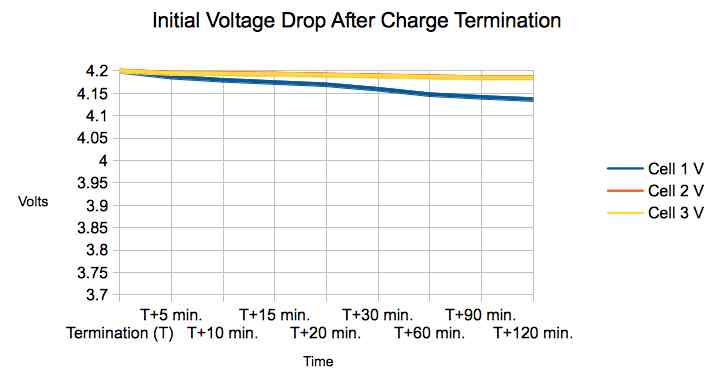 A second graph shows the same data but with the range increased to between 3.7V and 4.2V, the typical working range for a 4.2V LiPo cell. Another graph, starting at 0 volts, demonstrates how small millivolts are when compared to the whole range from 0V to 4.20V. 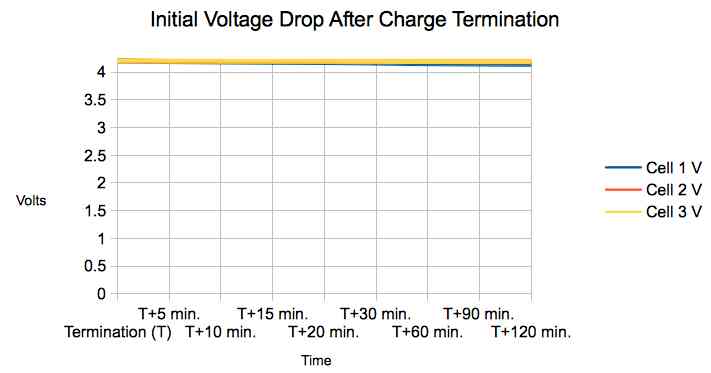 Later that day, the charged G25 pack was flown for 6 minutes in the SuperEZ. The power system was equipped with the remote data unit (RDU) from the Emeter II. The RDU contains, what appears to be, a coulomb counter, as it measures mAh removed from the pack. The RDU logged data was later transferred to a computer file. The G25 pack sat in basement for quite awhile after arriving home from flying field. The data was acquired at an ambient temperature of 190C.
The voltages matched on the ESR meter and Gt500, but the percent of remaining capacity, based on the resting voltage, did not. I have two other devices that read voltage and estimate the percentage of capacity remaining in the pack by the resting, or open, voltage. The meters are the CellMeter-8 from Hobby Lobby International, NOT the one from Hobby King, and the ElectriFly PowerMatch. CM-8: pack voltage 11.374V/36%, cell #1 3.777V, cell #2 3.797V, cell #3 3.801V
All four measuring device's capacity remaining percents are compared:
One commonly used table for percent of remaining capacity by resting volts shows:
Another table shows:
While the percentages of remaining capacity, based on the resting voltage, are somewhat similar, it does not appear that using them is very accurate or consistent. Later, I found that it doesn't appear to work well at all. The Emeter II RDU data showed 618mAh pulled from the pack's cells. That would indicate 38.2% capacity left in the cells, if the cells truly had a capacity of 1000mAh. The voltage numbers after this 'training type', six minute flight, did indicate more 'typical' ending cell voltages for the G25 pack, rather than the lower voltages reported previously. The pack was fully charged at 1 amp to 4.20V on the Gt500 to see what capacity the charger noted when it detected the pack as full. The full charge took 45 minutes 36 seconds. 660mAh was returned to the pack, according to the charger, which seemed logical if 618mAh was reported taken from the pack during the flight. Since the pack was fully charged, I looked at the initial rapid voltage drop again. This phenomena has often been noted anecdotally, but seldom documented. I found it interesting that Battery University included this initial rapid voltage drop as part of the cell's self discharge. The somewhat dramatic drop appears to be caused by the cells settling down from being extremely 'excited' while charging. This does happen to most battery chemistries, to varying degrees. 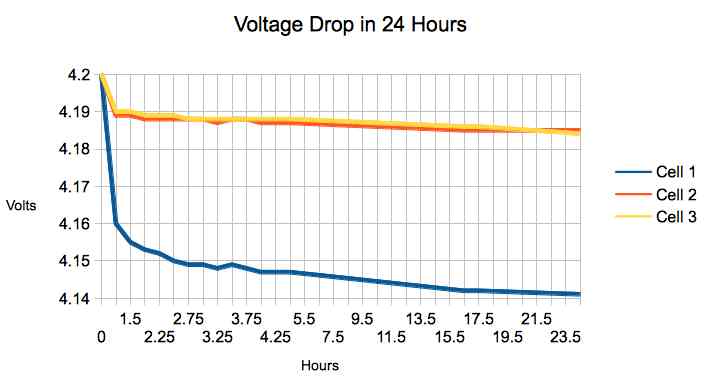
The tables show the relatively large initial voltage drop happening in the first hour to two hours after the charge termination for this chemistry. The data is identical in both tables, only the voltage range is changed. The Giles ESR meter data was collected after 24 hours.
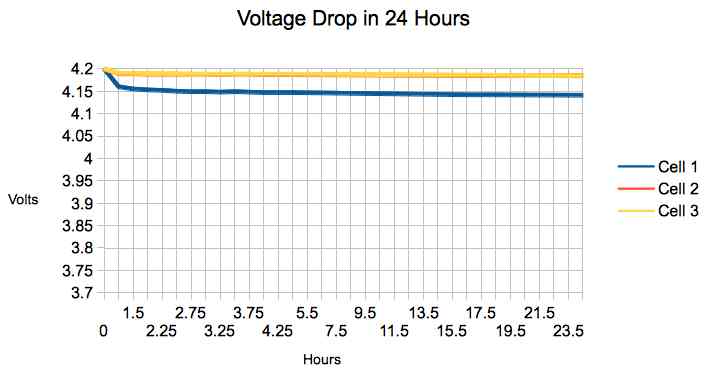
Cell number 1, which has the highest resistance, also has the lowest resting voltage. Further testing confirmed that the cell with the lowest resting voltage, after the initial rapid voltage drop, had the highest Ir. The greater the difference in the resting voltage, the greater the Ir difference was. Next, the R60 and T30 packs' initial rapid voltage drop and self discharge voltages were recorded over 24 hours and graphed. All of the data gathering was completed in the basement during the same time period. That kept the ambient temperature relatively the same. Immediately after the 24 hour reading on the Gt500, the ESR Meter was used to collect the data on the two packs at 18.50C.
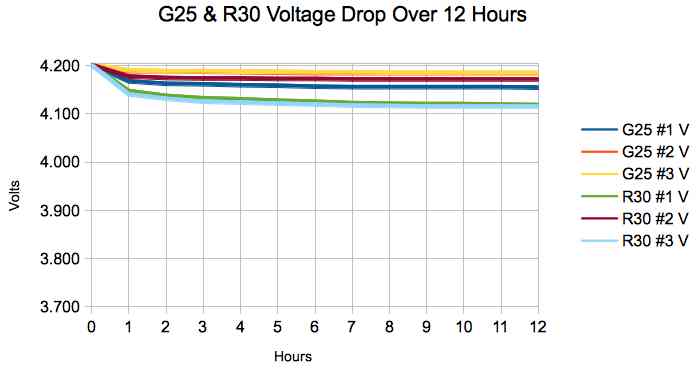
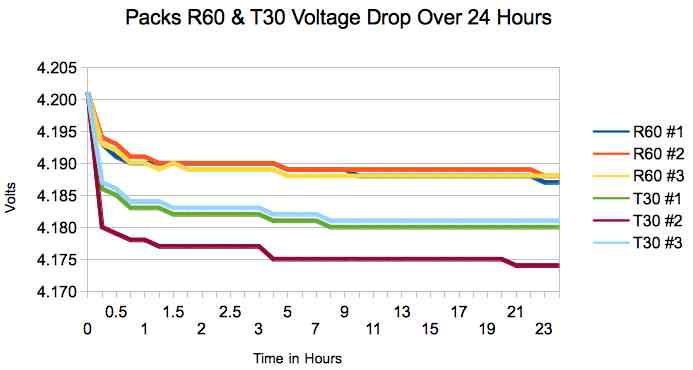 The T30 pack dropped more during the initial rapid voltage drop, stabilized at a lower voltage and its cell #2 is at a lower voltage, compared to #1 and #3, and remains so through the 24 hour period. All of the cells in the R60 pack tracked very closely and the initial rapid voltage drop was much smaller than pack T30. 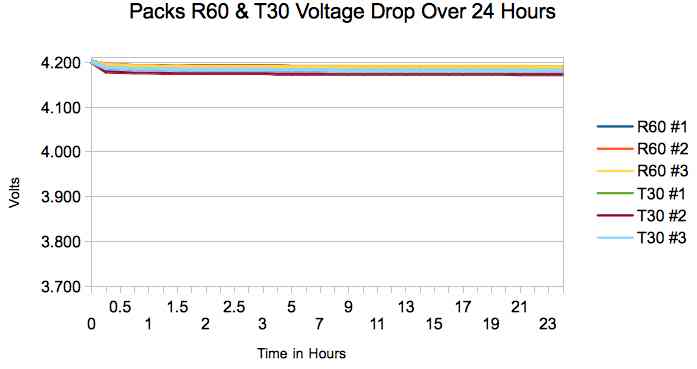 The second graph shows the exact same data, but with the voltage range increased. The table shows the very small voltage range where the data was collected. The voltage range now illustrates the usable LiPo cell voltage range. Even with the greater voltage range shown in the graph, pack T30's cell #2 stands out. 24 hours after pack T30's charge, cell #2 had a reading of 34.80mOhm on the Giles ESR Meter at 190C and a voltage reading of 4.174V on the Gt 500. The R60's #3 cell also stands out on this greater voltage range graph. 24 hours after the R60's charge, cell #3 had a reading of 9.16mOhm on the Giles ESR Meter at 190C and a voltage reading of 4.188V on the Gt 500 in monitor mode. The G25 pack and R30 pack were at approximately the same state of charge (SOC), based on the resting voltage. 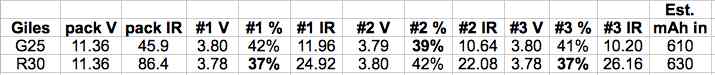 The Est. mAh column in based on the SOC noted as percent on the Gt500 charger. 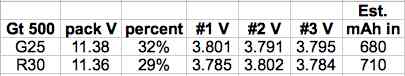 The Giles ESR meter showed 39% for the highest Ir cell in pack G25 and 37% remaining for the highest Ir cell in pack R30. Both meter readings indicate a similar SOC, based on resting voltage. IF the resting voltage was a reasonably accurate way to determine the remaining capacity, according to the Gt500, approximately 700mAh should be returned to both packs and according to the Giles ESR Meter, approximately a bit over 600mAh should be returned to both packs. Once again, the two packs, even though their SOC, based on resting voltages, were similar, did not show the same capacity returned to the packs. 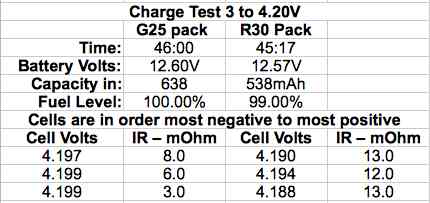 The packs took approximately the same amount of time to charge to termination. There was a 100mAh difference in the mAh returned to the packs. Since the packs were charged, the initial rapid voltage drop and self discharge were graphed over a 12 hour period. 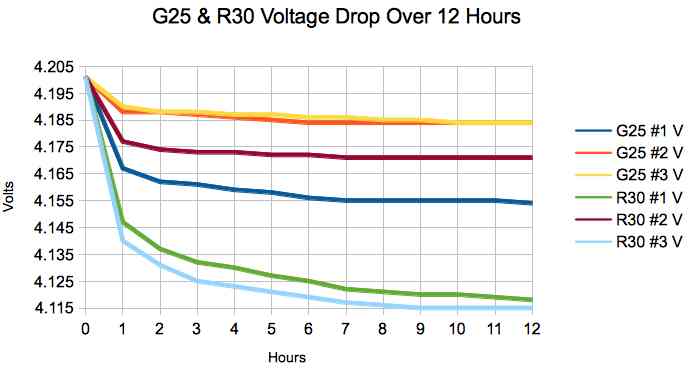
As previously noted, the graphs indicated that it takes an hour to two hours for the initial voltage drop stage to become somewhat more stable and actually enter the self discharge stage. The Giles Meter data after 12 hours. The ambient temperature was 190C.
The R60 pack and T30 pack were set up for parallel charging using the Buddy RC AFE 40A PARABOARD V3. The packs were at the same SOC, based on resting voltage, as noted by the Gt500 in monitor mode. 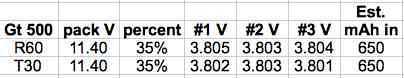 The charger was set to charge at 2 amps with a 4.20V termination per cell. I expected more than 1300mAh/1.3Ah to be returned to the two packs combined, if I believed the percent of capacity remaining as noted by the charger in the Est. mAh in column. At 32 minutes into the charge the votages had all reached 4.201V, 100% and about 1.04Ah had been retuned to the pack. The charge took 41 minutes and 58 seconds. The charger reported 1.10Ah/1100mAh returned to the pack(s). Humm? When I looked at both packs' voltages on the Gt500 in monitor mode, within a few seconds of the charge termination, they were into their initial rapid voltage drop, but the numbers seemed consistent with what I'd seen in previous parallel charges with these packs. The packs were rested for two hours.
 It appeared that parallel charging a 'good' pack with a 'poorer' pack had caused the 'good' pack to not charge well. The T30 pack displayed lower voltages after two hours than I had been seen before when that pack was charged by itself. Since the SOC, based on cell resting voltage, is not an accurate, nor consistent means of identifying the 'real' SOC, it appears best to only parallel charge packs with similar resting voltage readings AND, more importantly, similar mOhm readings. Later that day, all four of the charged packs were flown for 6 minute timed flights using the SuperEZ as a trainer. The RDU was used to gather mAh expended during the flights. The RDU data showed the volts, amps, time and mAh. The exact time the battery was 'on' was shown as well as the mAh pulled from the pack. The RDU recorded mAh from the pack was compared to what the Gt500 displayed as the mAh returned to the pack.
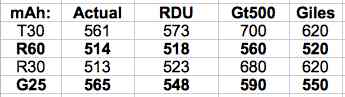 The table columns;
The estimates for the Gt500 and Giles ESR meter, based on their percent of remaining capacity, were close for the R60 and G25 packs, but 'way' off for the T30 and R30 packs. The R60 and G25 packs are the 'good' packs with the lowest Ir per cell. The T30 and R30 packs are the 'poorest' packs with the highest individual cell internal resistances. Again, this demonstrates why cell resting voltage is not an accurate and consistent means to estimate the remaining capacity. The previous Charge Test 3 to 4.20V had demonstrated this observation as well. According to the resting voltage, packs R60 and T30 were at the same state of charge, yet R60 'took in' 638mAh while only 538mAh was returned to pack T30. 1. Resting voltage is not a consistent nor accurate way to determine the state of charge (SOC) of a LiPo battery. Don't rely on it. 2. There is a rapid initial voltage drop after the termination of the charge. It might not look like the charger reached termination voltage if the observer was not directly observing the charger at exactly the point of termination. By the time the pack is removed from the charger and another type of meter is hooked up to it, it is already in the initial rapid voltage drop stage. 3. It takes about an hour to two hours for the voltage to stabilize somewhat and truly enter the self discharge stage. 4. Cells of the same capacity with a greater internal resistance have a greater initial voltage drop. 5. Voltage readings taken on the individual cells of a pack can differentiate the cell with the highest Ir. 6. My Gt500 gives questionable Ir readings. 7. A better battery management system would compare mAh used to mAh returned to the pack during charging. After I had finished this article, I found a document on the Internet that had almost all of this information in it. I strongly urge you to read it. To Reach Ken Myers, you can land mail to the address at the top of the page. My E-mail address is: KMyersEFO@theampeer.org |