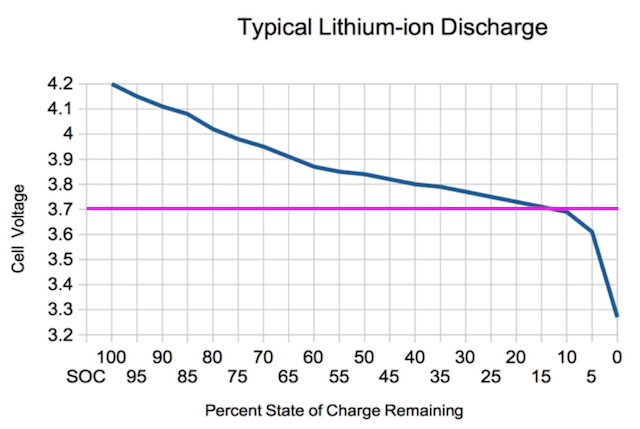
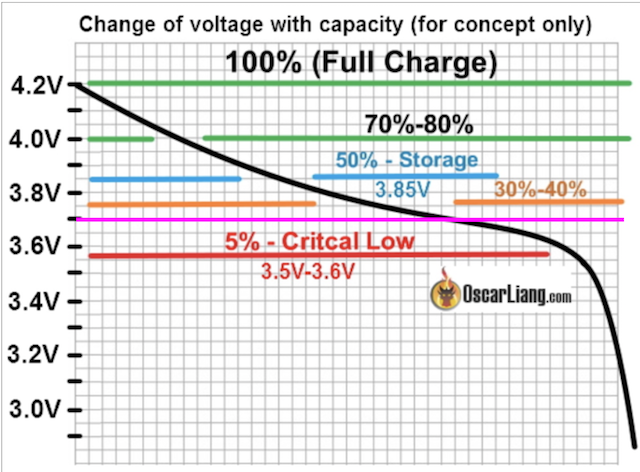
Below are two graphs that show somewhat typical discharge curves for Lithium-ion based type batteries with nominal voltages noted as 3.6V or 3.7V. I made the first one based on information from the previously shown chart by Mark Forsyth. The second one comes from Oscar Laing's Website. I added a magenta colored line to both graphs. Please note the voltage at the position of the magenta line and its relationship to the discharge curve on each graph. (The graphs are for nominal 3.7V types.)   Both graphs indicate that there is very little capacity, run time in our case, left in the battery before it hits the discharge "knee" and the voltage drops drastically. Therefore 3.7V becomes a significant number. (Further research indicates that a lower voltage than 3.7V might be more significant and will be noted later in this article.) |